

Analyzing data with Google Analytics helps improve your website’s performance. It provides insights into user behavior and site metrics.
But how do you start? Understanding Google Analytics can seem daunting at first. Yet, it’s a powerful tool for anyone looking to optimize their website. This platform offers detailed reports on traffic, user behavior, and more. By learning to navigate these features, you can make data-driven decisions.
This blog will guide you through the basics of using Google Analytics. We’ll explain how to set up your account, read reports, and use the data effectively. Whether you are a beginner or looking to enhance your skills, this guide is for you. Dive in and discover how to turn your website data into actionable insights.
Credit: www.analyticodigital.com
Introduction To Google Analytics
Google Analytics is a free tool from Google. It helps you track website traffic. It shows where visitors come from. It tells you what they do on your site. It also shows how long they stay. With this data, you can improve your site. You can make better decisions. You can see what works and what does not. This helps grow your business.
Data analysis is very important. It helps you understand your audience. It shows what content they like. It tells you what pages they visit. You can see which products are popular. This helps you make better choices. You can improve your website. You can increase sales. You can reach more people. Data analysis helps you succeed.
Setting Up Your Google Analytics Account
Start by going to the Google Analytics website. Click on “Start for free”. Use your Google account to log in. If you don’t have one, create a new Google account. Follow the prompts to set up your account. Enter your website or app details. Choose the right settings for your needs. Finally, click on the “Create” button.
Find the tracking code in your account settings. Copy this code. Paste it into the HTML of your website. Place it just before the closing tag. This will help you track visitors. Ensure every page you want to track has this code. Save the changes to your website.
Navigating The Google Analytics Dashboard
The Google Analytics dashboard is your control center. It provides a quick view of your website’s performance. You can see real-time data, user behavior, and audience details. Each section offers different insights. These insights help you understand how visitors use your site. The dashboard is easy to navigate. Just click on the sections you want to explore.
Key metrics show your site’s performance. Important metrics include sessions, users, and page views. Sessions tell you how often people visit. Users show how many unique visitors you have. Page views count the total pages viewed. Reports provide detailed data. Custom reports can be created to focus on specific data. This makes it easier to analyze trends and patterns.
Understanding Audience Data
Google Analytics helps you learn about your audience’s demographics. This includes age and gender. You can also see their interests. This data shows what your audience likes. This helps you make better content. For example, if most visitors are young, you might use modern slang. If they like sports, you might write about sports more. Knowing your audience is key. It makes your content better.
User behavior data shows how people use your site. This includes how they move through your pages. You can see which pages they visit most. You can also see how long they stay on each page. If they leave quickly, your page might need work. Good user behavior data helps you improve your site. This makes users happy. Happy users come back.
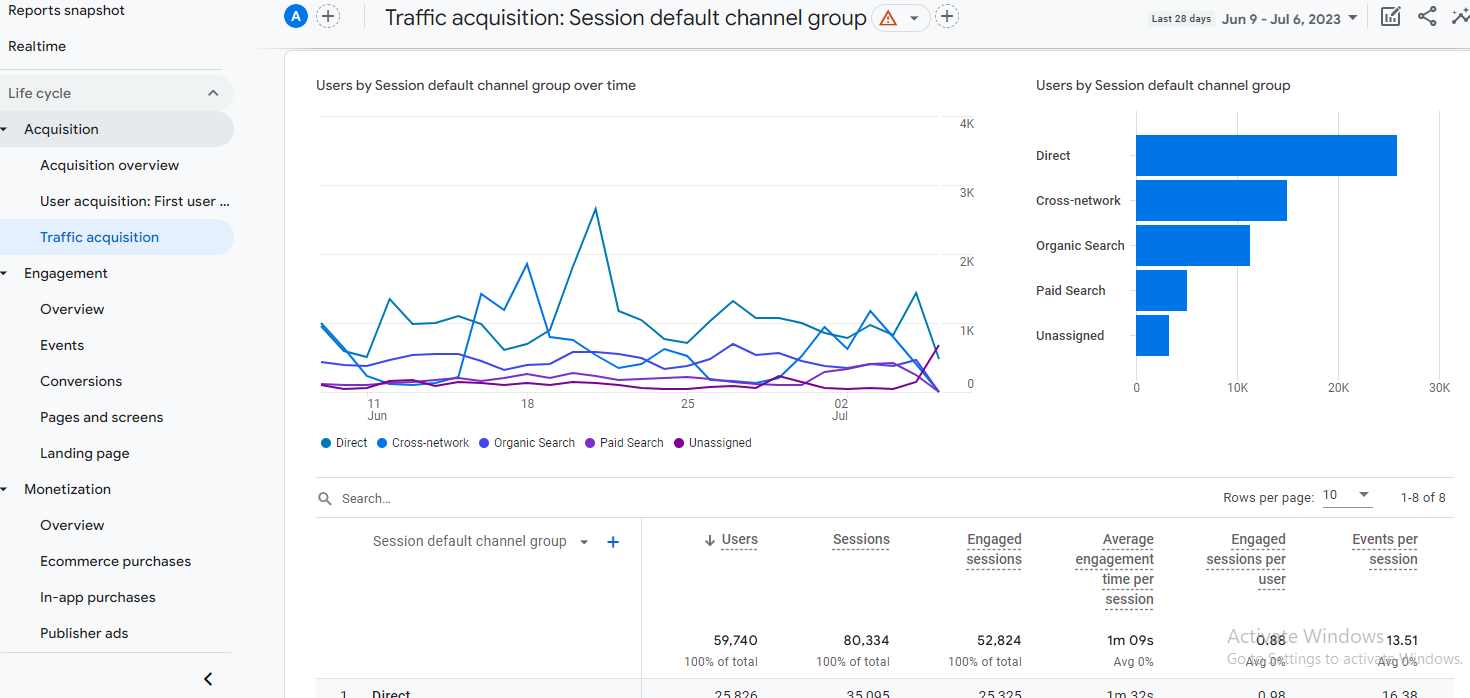
Analyzing Acquisition Data
Analyze data with Google Analytics to understand user behavior and improve website performance. Track sources, measure engagement, and optimize strategies for better results. Gain insights to enhance user experience and drive growth.
Traffic Sources
Traffic sources show how users find your site. These sources include search engines, social media, and direct visits. Google Analytics helps you see which sources bring the most traffic. Organic search is traffic from search engines. Direct traffic is from users typing your site URL. Referral traffic comes from other websites linking to yours. Social traffic is from social media platforms. Analyzing these sources helps you understand where to focus your efforts.
Campaign Performance
Campaign performance tracks your marketing efforts. Google Analytics shows how well each campaign does. You can see clicks, conversions, and revenue. UTM parameters help track specific campaigns. Use these to compare different ads or posts. Look at metrics like bounce rate and time on site to measure user engagement. This data helps improve future campaigns.

Credit: measureschool.com
Interpreting Behavior Reports
Site content analysis helps you understand what visitors like. Check the most viewed pages. These pages show user interests. Look at the bounce rate. A high bounce rate means users leave quickly. Improve these pages to keep users longer. Review the average time on page. This shows if content is engaging. Pages with more time are better. Use this data to create similar content.
Site speed is crucial. Slow sites lose users. Check the average load time. Faster load times improve user experience. See the speed suggestions. These help you fix issues. Improve images and scripts. Faster sites rank better in search results. Users stay longer on fast sites. Keep monitoring site speed regularly. This ensures a smooth experience for all visitors.
Evaluating Conversion Data
Goals help you see if users complete tasks on your site. These tasks can be purchases, sign-ups, or other actions. Funnels show each step users take to reach a goal. If many users drop off at one step, you may need to fix that part of your site. Analyzing this data helps you improve user experience and increase conversions.
E-commerce tracking shows how well your online store performs. You can see which products sell best. You can also see how much revenue each product generates. Track the shopping behavior of users. See where they leave the purchase process. This information helps you understand and improve your sales funnel.
Advanced Analysis Techniques
Segmentation helps break down your data. You can see specific groups of users. This makes it easier to understand user behavior. Create segments by age, location, or device. Look for patterns in these groups. Segments show how different users interact with your site. This can help in making better decisions.
Custom reports let you tailor your data view. You can choose what metrics to see. This helps focus on what matters most to your business. Select dimensions and metrics that align with your goals. Build reports to track specific campaigns or user actions. Custom reports save time and provide clear insights. They make data more meaningful.
Tips And Best Practices
Discover how to analyze data with Google Analytics effectively. Focus on setting clear goals, tracking key metrics, and using custom reports. Make informed decisions by understanding your audience’s behavior and preferences.
Regular Monitoring
Check your Google Analytics data daily. Identify any sudden changes. These changes can be spikes or drops in traffic. Regular checks help spot problems early. You can also see trends over time. It’s important to keep track of key metrics. Monitor bounce rate, session duration, and user behavior. This helps in understanding visitor actions. Regular monitoring keeps your data fresh and accurate.
Actionable Insights
Focus on key metrics. Look at user behavior reports. These reports show what visitors do on your site. Check the most visited pages. Find out which pages have high bounce rates. Improve these pages to keep users engaged. Use conversion data to see what drives sales. Adjust your strategy based on this data. Make data-driven decisions. This leads to better results and improved performance.

Credit: www.kaushik.net
Frequently Asked Questions
What Is Google Analytics?
Google Analytics is a powerful tool for tracking website traffic. It provides insights into user behavior and website performance.
How To Set Up Google Analytics?
To set up, create a Google Analytics account. Add the tracking code to your website. Start collecting data.
What Are Key Metrics In Google Analytics?
Key metrics include sessions, users, bounce rate, and conversion rate. These metrics help analyze website performance.
How To Track User Behavior?
Use Google Analytics to track user behavior. Analyze reports on user flow, session duration, and page views.
Conclusion
Using Google Analytics helps you understand your website’s data. This tool is powerful and user-friendly. Track your visitors, their behavior, and conversions. Regularly review your reports for insights. Make informed decisions to improve your site. Practice and patience are key.
Start today and grow your data skills. The more you analyze, the better you get. Happy analyzing!
[…] keep track of these metrics, use tools like Google Analytics or email marketing software. Regularly reviewing these metrics helps identify trends and areas for […]